Content
The functionality is currently still in the BETA phase. It is therefore possible that this screen is not yet available to you and the following screenshots may not correspond to the current version. We are actively working on this screen and are constantly incorporating user feedback. It will also be made available to our customers in stages. You will be informed as soon as it is rolled out for your company.
What is the Analytics Center?
In the Analytics Center, you are shown summaries of important data in diagrams, e.g. for the automation of individual invoice fields. This gives you an overview of the use of Finmatics and allows you to optimise it.
How do I activate the Analytics Center?
You need the "View Analytics" permission for this. You can find more information on how to configure this setting in How are users managed?.
Where can I find the Analytics Center?
You will find the tab in the menu on the left. Click on "Analytics" to open the Analytics Center.

What information can I see?
Specify in advance the period for which you want the data to be displayed. To do this, click on the filter symbol and select a time period between three and twelve months next to the "Period" filter. Also use the "Count mode" filter to decide whether analyses for invoices or individual booking lines should be displayed.
Optionally, you can differentiate whether the data of all clients of a specific company and/or a specific responsible user should be displayed.
If required, you can use the drop-down menu under "All clients selected" to search for and select a specific client. The dashboard is then updated automatically.

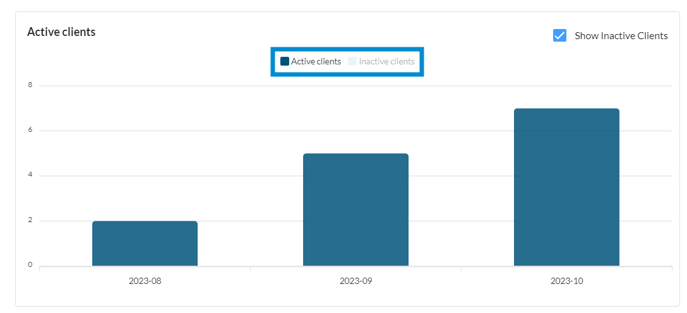
Active/inactive clients
Here you can see the number of clients for which invoices/booking lines have been processed per month. A client is displayed as "active" if at least one invoice or one booking line has been processed in the respective month.
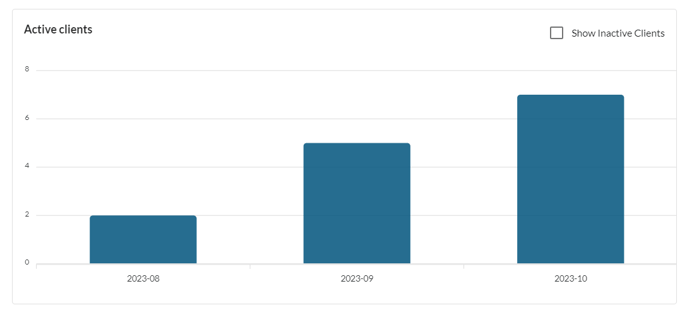 Inactive clients are hidden by default and can be shown by ticking the checkbox.
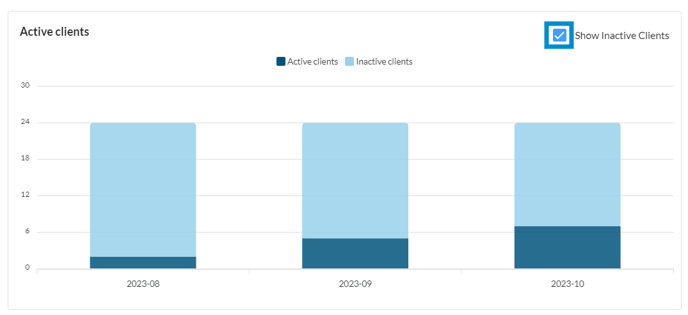
Alternatively, you can display the exact number of active/inactive clients by hovering over the column in the diagram.
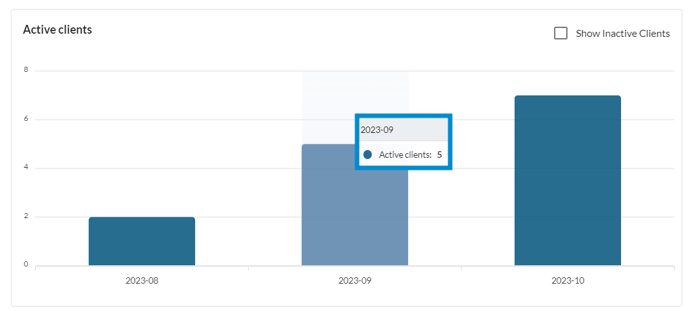
You can also hide the columns in the diagram completely by clicking on "Active clients" and/or "Inactive clients".
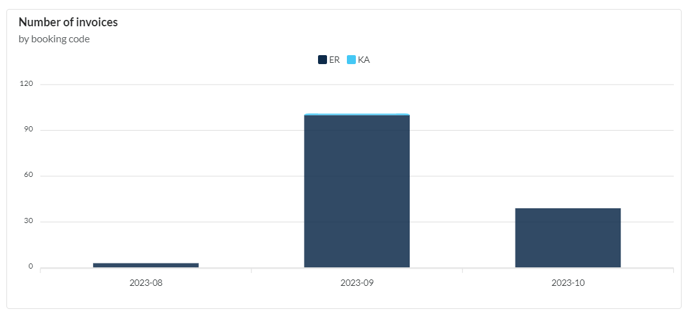
This chart shows you how many bookings have been made or how many booking lines were created per month, organised by booking code. You can also hover over the columns here and show or hide individual booking codes.
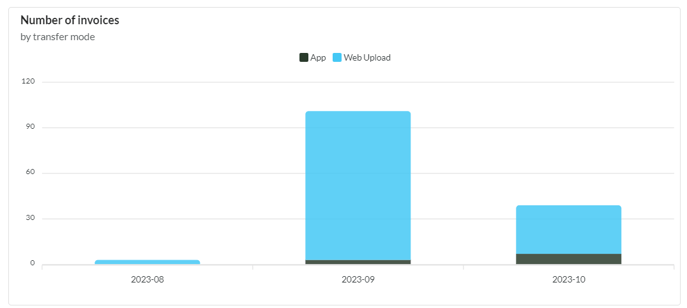
Number of invoices/invoice items by transfer mode
In this diagram you can see all received invoices or created booking lines per month organised by transfer method. It is also possible to show, hide and hover here.
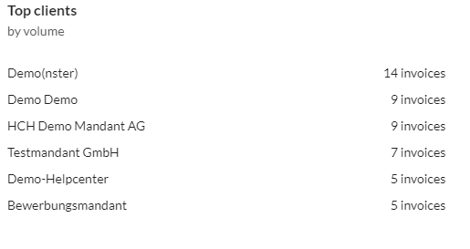
Top clients by volume
On the right you will see a selection of the clients who have made the most bookings in Finmatics in the selected period.
Distribution of invoice/booking lines by booking code
Here you will find an overview of how many invoices have been transferred to Finmatics per booking code in the set timeframe. The information is also displayed in a pie chart, which you can hover over with the mouse pointer.

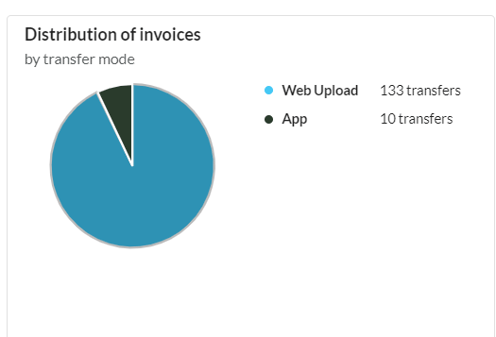
Distribution of invoices/booking lines by transfer mode
In this field you can see how many invoices have been transferred to Finmatics by transfer method, e.g. via web upload or e-mail.
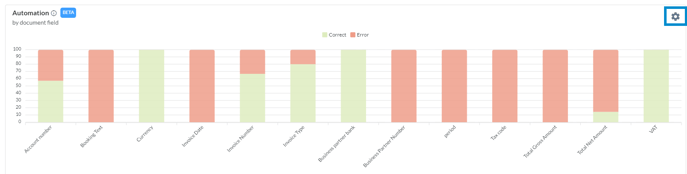
Automation by document field
The automation rate diagram is currently still under development and will be available for you soon.
You can find this diagram at the bottom of the screen. There you can see columns for all invoice fields that were read out in the set timeframe. Here you can see how often a invoice field was read correctly or incorrectly, or how often there was no feedback.
"No feedback" means that Finmatics does not know whether the prediction was correct or incorrect as these invoices have not yet been confirmed by an accountant. Alternatively, this message appears if you did not work in the Finmatics frontend and no feedback was sent back to Finmatics from your ERP system.
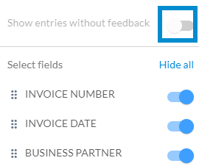
Booking lines without feedback are hidden by default. You can show these in the diagram by activating the "Show entries without feedback" slider in the settings on the right. You can also show or hide individual fields here under "Select fields". In general, you can hover over the individual columns here.